Numpy Random Chisquare Distribution
The purpose of this article is to discuss Numpy Random Chisquare distribution and how to utilize the numpy library to produce random numbers and analyze various statistical properties.
What is Chisquare Distribution?
The chisquare distribution is a continuous probability distribution used in statistics to model the sum of the squares of k independent standard normal random variables.
The chisquare distribution has a single parameter, k, which represents the degrees of freedom.
The PDF of the chisquare distribution is given by:
f(x; k) = 1/(2^(k/2) * Γ(k/2)) * x^(k/2 - 1) * e^(-x/2)
where Γ is the gamma function, x is the random variable, and k is the degrees of freedom.
Numpy Random Chisquare
The numpy random chisquare function is used to generate random numbers from a chisquare distribution.
The function takes the degrees of freedom (df) as input and returns an array of random numbers from the chisquare distribution with the specified degrees of freedom.
Syntax
numpy.random.chisquare(df, size=None)
There are Three parameters in it:
| Parameters | Overview |
| df | (level of freedom). |
| size | Displays the array’s shape. |
| None | Default value is None, which returns a single random number. |
Calculate the chi squared distribution with the following degree of freedom (30) and dimension four by one:
Example:
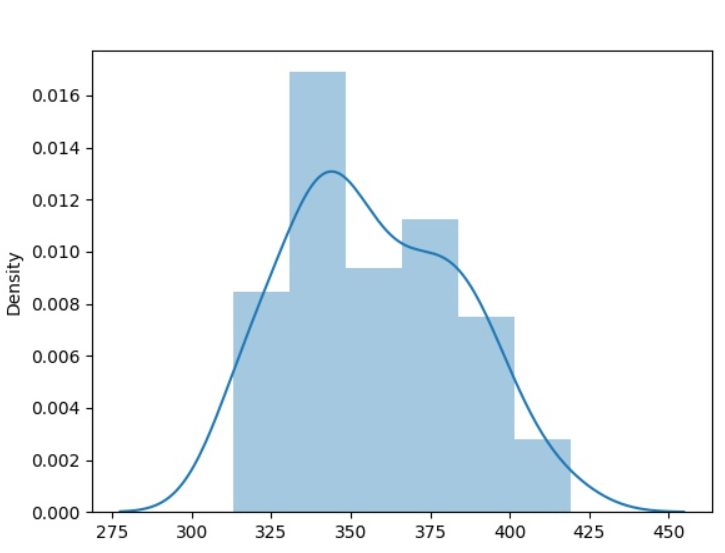
Make a sample for chi squared probability with degree of freedom 360 and size two by two:
Example:
ChiSquare Distribution Visualization
The matplotlib library is a popular Python library for data visualization. It provides a wide range of methods to create high-quality plots, including histograms, line plots, scatter plots, and more.
In this case, we can use matplotlib to plot a histogram of the random numbers generated by numpy random chisquare.
Visual representation of the Chi Square Distribution:
Example:
Show the Chi Square Distribution with histogram and kernel density estimation:
Example:
Numpy random chisquare is useful in many applications.
Some of them shown in below table:
| Applications | Overview |
| Statistical Analysis | The chisquare distribution is used in statistical analysis to test the goodness of fit of a given model. Numpy random chisquare can be used to generate random data for simulations to test statistical models. |
| Physics | The chisquare distribution is used in physics to model the distribution of the sum of squares of errors in measurements. Numpy random chisquare can be used to generate random errors for simulations. |
| Finance | The chisquare distribution is used in finance to model the distribution of asset returns. Numpy random chisquare can be used to generate random returns for simulations. |
If you’re interested in learning more about Numpy random methods and staying up to date with the latest article, be sure to subscribe to our newsletter below.
